

Key Results of the Laboratory 2023-2024
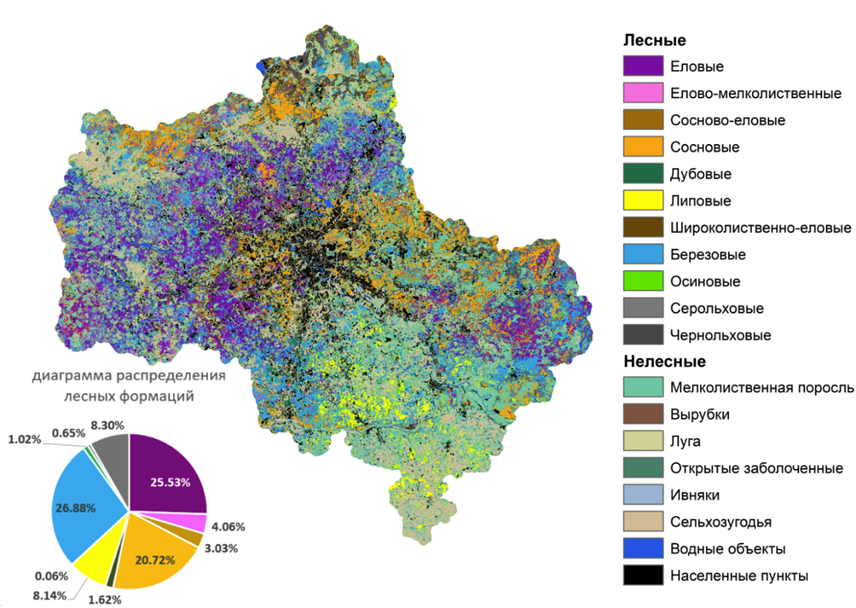
1. A study was carried out to assess the role of local and external environmental factors in forest diversity in the Moscow region. By integrating field research results with global raster databases characterizing the state of forest ecosystems, it was shown that forest biodiversity is more strongly related to local than to external factors. Soil acidity was found to be the most significant local factor determining forest type, while mean annual air temperature and soil carbon content were the most significant external factors. Despite the long history of land use in the Moscow region, anthropogenic factors are less significant than natural ones. The forests of the Moscow region currently retain the main characteristics of local broadleaf-coniferous forests, including a diverse stand composition, a multi-tiered community structure, and rich species diversity.
Published: Chernenkova, T., Belyaeva, N., Novikov, A., Kotlov, I. Driving Factors of Forest Typological Diversity in the Moscow Region // Forests. 2024. №15. Вып 10, С. 1683. https://doi.org/10.3390/f15101683
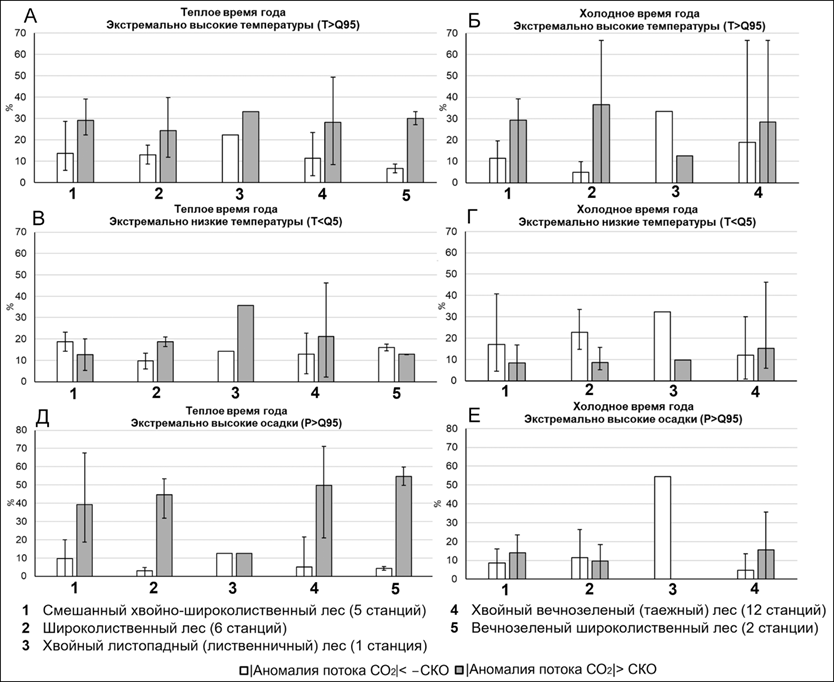
2. Based on data from 26 ecological-climatic stations of the international FLUXNET network, the influence of extreme air temperatures and precipitation on ecosystem CO2 fluxes in extratropical forests was studied. It was found that extremely high air temperature at any time of year leads to increased CO2 emission into the atmosphere, while negative air-temperature anomalies during the warm half-year can lead either to increased or decreased CO2 uptake by forest ecosystems, depending on the biome. Intense precipitation in the studied forest ecosystems predominantly leads to CO2 emission into the atmosphere. The results of the study will help develop methods for forecasting the carbon balance of forest ecosystems under present-day climate change (Satosina et al., 2024).
3. An innovative method has been proposed for determining greenhouse gas (GHG) fluxes between the land surface and the atmosphere over complex terrain, based on measuring their concentrations in the atmospheric boundary layer (ABL) using unmanned aerial vehicles. The uniqueness of the method lies in combining GHG measurements with a three-dimensional hydrodynamic model of the ABL, capable of accurately reproducing the turbulent conditions responsible for GHG redistribution over heterogeneous landscapes. The methodology provides new opportunities for studying the spatial variability of GHG fluxes in regions where direct measurements are difficult or impossible, such as foothills, remote taiga areas, and mires. Published: Mukhartova et al., 2024.
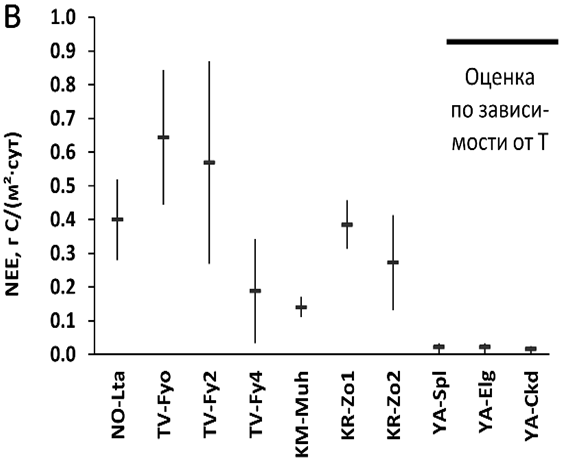
4. Based on the joint work of the soil respiration monitoring group, formed as part of the Major Innovative Project of National Importance aimed at creating the Russian Climate Monitoring System (RCMS), a review was conducted of the existing network of chamber-based soil respiration observations across the Russian Federation. The first estimates were obtained for a number of representative ecosystems in various regions of Russia (Kurganova et al., 2024).
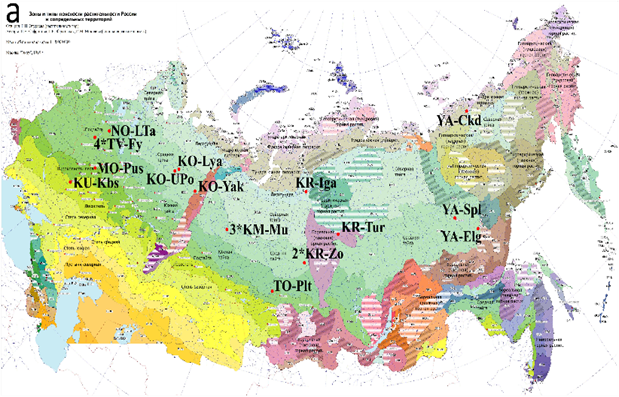
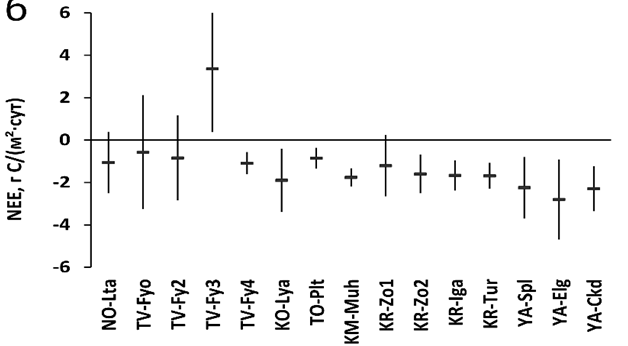
5. Information on the history of the formation of the RuFlux greenhouse gas (GHG) monitoring network in Russia was compiled for the first time. A summary of the observation results showed that almost all undisturbed ecosystems in Russia act as CO2 sinks, with a mean annual net uptake ranging from 80 to 240 g C/m2·year. The GHG balance is determined by physical-geographical and biological factors. The mean long-term net CO2 uptake is higher in Siberian larch forests (L) on permafrost than in spruce forests (E) of European Russia, despite the shorter growing season (less than 4 months for L versus more than 6 months for E). The intensity of the CO2 sink increases in midsummer, while CO2 emission in midwinter decreases sharply from west to east. Natural and anthropogenic disturbances lead to increased CO2 release into the atmosphere.
Published: Kuricheva O.A., Авилов В.К., Варлагин А.В., Мамкин В.В., Курбатова Ю.А. и др, 2023. Мониторинг экосистемных потоков парниковых газов на территории России: сеть RuFlux // Известия РАН. Серия географическая. Том 87. № 4. С. 512–535. DOI: 10.31857/S2587556623040052
An open-access Archive of Vegetation Data of the Russian Arctic, AVA-RU (https://avarus.space), has been prepared and made publicly available. The purpose of the Archive is to collect, store, harmonize, and disseminate data on the vegetation and environment of the Russian Arctic. The Archive contains 2873 openly accessible geobotanical descriptions. The data include a complete inventory of species composition and information on vertical and horizontal structure. In addition to the open data, the AVA-RU website hosts 1912 descriptions with restricted access. About 72% of the descriptions have geographic coordinates. The data were collected between 1927 and 2022. The descriptions include more than 1770 species of vascular plants and cryptogamic species and subspecies.