

An employee of the Laboratory of Monitoring of Nuclear Power Plant Regions and Bioindication of the Institute of Ecology and Evolution of the Russian Academy of Sciences published an article in the journal Fish and Fisheries (IF=6.7) by Wiley as part of an international team from Russia, Hungary and Brazil.
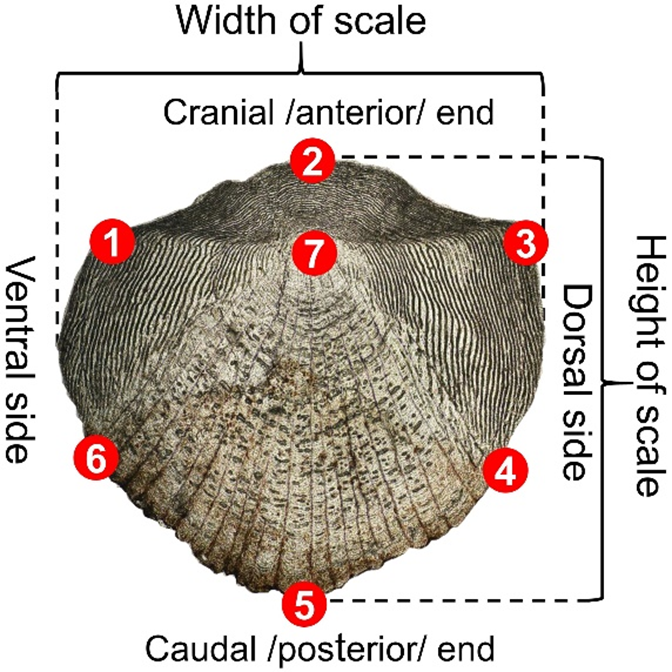
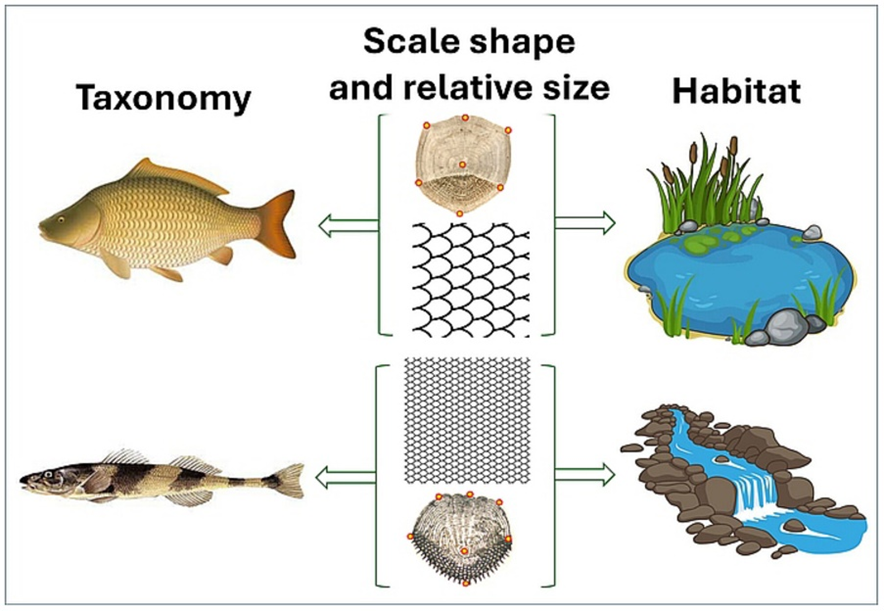
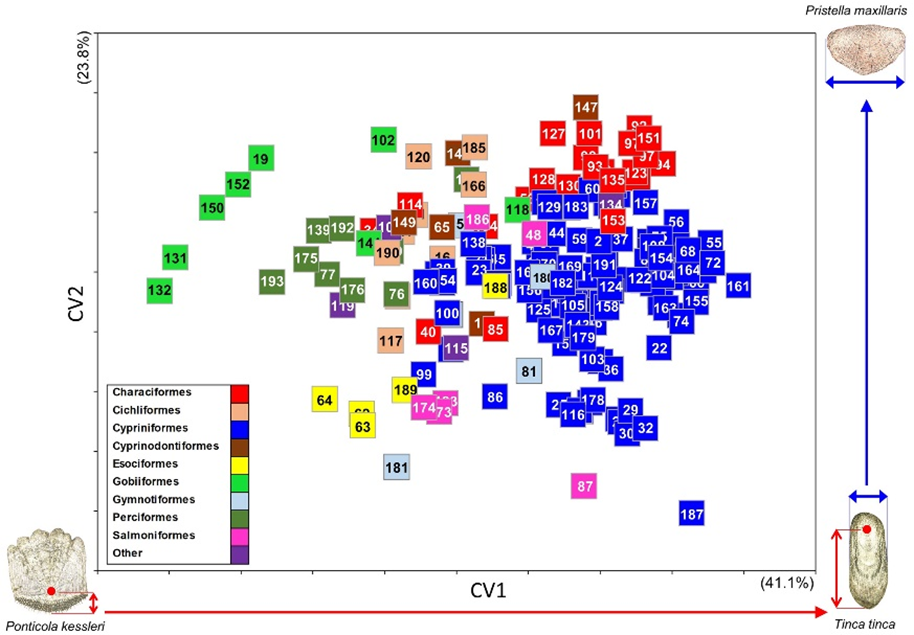
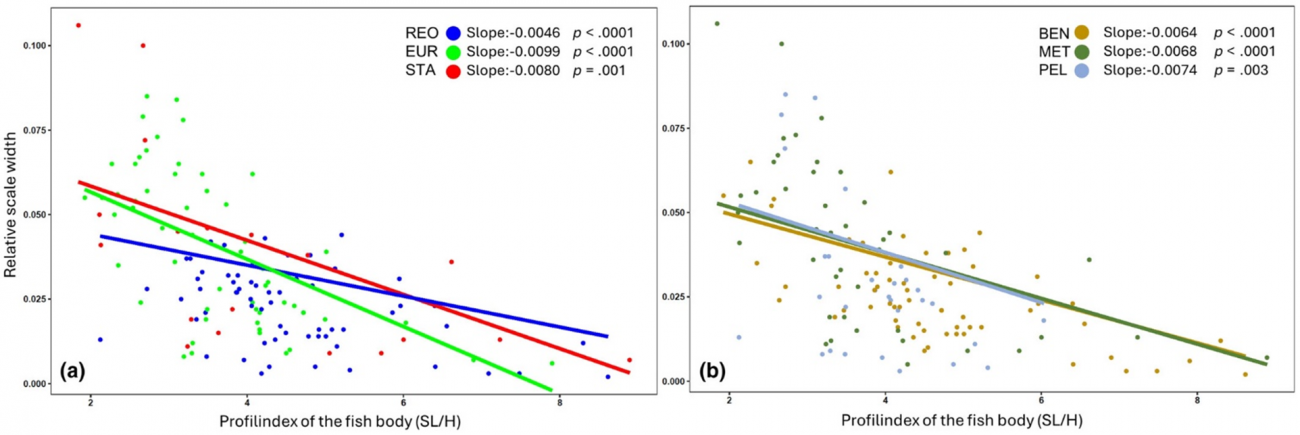
The published work is devoted to a large-scale study of the shape of freshwater fish scales and an attempt to use it as a taxonomic and environmental indicator. Despite the long-established value of scale morphology for taxonomy, its use for taxonomic identification purposes has generally been limited to the identification of high-ranking taxa. The authors analyzed the shape of the scales of 193 fish species from 14 orders belonging to 5 biogeographic kingdoms. Scale measurements were performed along with measurements of fish body length and height. The study showed that scales can be used to determine orders of fish, and when using additional data on the size of scales relative to the length and height of the fish’s body, species identification is also possible. The study showed that despite the fact that the shape and size of scales are genetically determined, they can also be used as indicators of the division of ecological niches (habitat, preferred flow rate regimes) of closely related species.
In summary, this study demonstrates that scale morphology is a promising additional tool for inferring the ecological preferences of species for which such information is absent or insufficient (including extinct species). The authors note the importance of expanding the database and the need to use artificial intelligence for the purposes of shape recognition and species identification based on the shape and texture of scales.
The work was supported by the Russian Science Foundation grant 19-04-00218 (Adaptive radiation and speciation in cyprinids under sympatry conditions).